

In this day and age, data is no longer a hidden treasure – but rather a secret ingredient of any successful business. However, without the right tools, that valuable information sits dormant, which means you’re missing out on the value it can unlock. Business Intelligence (BI) platforms promise to unlock the power of your data, transforming it from raw numbers into actionable insights that drive real results.
Here at RST Data Cloud, we help clients in crafting modern data platforms – the robust foundation upon which powerful BI solutions thrive. We understand the frustration of sifting through the options, and that's why we've created this comprehensive guide.
Consider this your one-stop shop for comparing the leading BI tools in 2024. We'll break down the key features, strengths, and potential drawbacks of each platform, so you can make an informed decision. Let’s get started!
TL;DR
To help you navigate the diverse landscape of BI tools, I’ve compiled a brief comparison highlighting the most significant advantage and disadvantage of each tool mentioned, providing a snapshot for quick assessment.
Tableau
Top advantage: unmatched data visualization capabilities with interactive and shareable dashboards.
Top disadvantage: can be expensive, especially for small businesses or individuals, and performance may degrade with very large datasets.
Microsoft Power BI
Top advantage: cost-effectiveness, with a free desktop version and a competitively priced Pro version, combined with deep integration with Microsoft's ecosystem, so it’s a natural choice for those already working with it.
Top disadvantage: to share reports and dashboards, both the creator and the recipient need a Pro license, potentially increasing costs for larger teams. While powerful, it might offer less advanced customization and analytics capabilities compared to some of its competitors, especially for very complex datasets.
Qlik Sense
Top advantage: unique associative engine for intuitive, non-linear exploration of data relationships across multiple sources.
Top disadvantage: there is a learning curve to fully leverage its unique associative data model, and it may be perceived as expensive by some organizations.
SAP BusinessObjects
Top advantage: comprehensive suite of analytics tools supporting a wide range of reporting and analysis needs across an organization. Deep integration capabilities with SAP ERP systems, offering extensive reporting features for businesses heavily invested in SAP.
Top disadvantage: complexity and a steep learning curve, especially for new users not familiar with enterprise-level BI solutions, making it less suitable for quick, ad-hoc reporting by business users.
IBM Cognos Analytics
Top advantage: advanced analytics capabilities with AI integration for automated data preparation and analysis. Strong enterprise governance and scalability, suitable for large organizations with complex data security and compliance requirements.
Top disadvantage: can be complex and challenging to learn, making it less accessible to users without a technical background. The interface and user experience might not be as modern or intuitive as some of the newer BI tools, potentially impacting user adoption.
Domo
Top advantage: cloud-native approach with real-time data updates and a strong focus on collaboration and mobile access, ideal for dynamic and distributed teams.
Top disadvantage: can be costly for smaller businesses and may exhibit performance issues with extremely large datasets.
Sisense
Top advantage: proprietary in-chip technology allows for fast data processing, making it highly efficient at handling large datasets and complex analytics.
Top disadvantage: the platform may require a significant investment in terms of learning and development to fully leverage its advanced features.
MicroStrategy
Top advantage: offers comprehensive BI features with a strong emphasis on mobile analytics, security, and scalable enterprise deployment.
Top disadvantage: the complexity and cost of the platform can be prohibitive for smaller organizations or those just starting their BI journey.

What is business intelligence and why should you care?
Business intelligence is essentially a combination of strategies and technologies that businesses use to collect, store, analyze, and interpret data. This data can come from a variety of sources, including sales figures, customer interactions, website traffic, social media, IoT devices and many more. Analyzing this data is indispensable for businesses to extract valuable insights into their operations, customers, and market trends.
It’s important not to confuse business intelligence with business analytics. I wrote a comparison of BI and BA in a separate article.
Here’s why BI is particularly important today:
- Ruling the data explosion: businesses are generating data in amounts so vast they are virtually exhausting, so to rule it instead of drowning in it, we need software that will analyze it and make sense of it. It’s the only way to turn the tsunami of data into actionable insights.
- Competitive edge: if you’re not benefiting from it just yet, your competitors certainly are. If you want to stay on top of the game rather than stay behind, you have to invest in a solid business intelligence solution.
- Maintaining customer focus: Growing your business is coupled with improving customer satisfaction and loyalty. BI can help you understand your customers better and empowers you to respond to their needs fast and provide more personalized offerings.
- Making data-driven decisions: BI equips businesses with insights to make informed choices about virtually all aspects of the business: from operations through marketing campaigns to product development.
- Maximizing efficiency: analyzing data on operations and processes helps businesses identify bottlenecks and areas for improvement and prioritize their actions effectively.
- Driving innovation: data analysis can spark new ideas and opportunities for product development, marketing strategies, and overall business growth.
BI helps businesses turn information into knowledge and knowledge into profit. It's a powerful tool that, when used wisely and creatively, can give your businesses a crucial advantage in today's world that is increasingly becoming data-driven.
Let’s now take a look at the options you have, starting with one of the most popular choices.
Tableau: actionable insights with intuitive visualizations
Salesforce’s Tableau is an integrated business intelligence and business analytics tool that has emerged as a market leader in the BI space for several reasons – exceptional data visualization capabilities, user-friendly interface, and robust data connectivity options being just some of them. It gathers information from various sources, like databases and cloud apps, and allows users to analyze it visually, helping them make sense of their data.
With Tableau, you can explore trends, identify patterns, and uncover hidden insights. It's like having a magnifying glass for your data, letting you zoom in on specific details or see the big picture.
Tableau is flexible and can be used by different industries, from finance to healthcare. It can be installed on your own computers or accessed online as a service. There's even a mobile app to analyze data on the go.
Pros of Tableau:
- Eye-catching visualizations: forget clunky charts and graphs – Tableau lets you create stunning, interactive visualizations that captivate diverse audiences. It's like transforming raw data into a simple and easy-to-digest infographic, making even complex information clear and engaging. This is especially powerful for presentations where you want to grab attention and leave a lasting impression.

- Intuitive drag-and-drop interface: Tableau throws away complicated coding. With its drag-and-drop functionality, anyone can become a data visualization whiz. You can simply drag and drop data elements onto the canvas, and Tableau will do all the heavy lifting. This means that users of all technical backgrounds can quickly explore and understand their data without needing programming expertise
- Powerful data analysis: despite its user-friendly approach, Tableau does not compromise on the depth of analysis. It provides advanced analytical capabilities, such as forecasting, trend analyses, and complex calculations, enabling users to derive deep insights from their data. This balance of accessibility and power makes it a versatile tool for both simple reporting and complex data exploration.
- Robust data connectivity: Tableau offers extensive data connectivity options, allowing users to connect to various data sources, including cloud databases, spreadsheets, SQL databases, and big data platforms. This flexibility in data integration ensures that users can easily access and combine data from multiple sources for comprehensive analysis.
- Improved data modeling: Tableau's star schema approach makes data modeling a breeze. Imagine a flat file as a disorganized mess of information. The star schema organizes your data efficiently, like a well-structured library. This makes it easier to analyze relationships within your data, leading to more accurate and insightful results.
- Device-responsive design: indeed! With Tableau, you don’t have to worry about reports looking wonky on different devices. The BI tool automatically adjusts your reports to look fantastic on any screen, be it a desktop computer, a tablet, or even a smartphone. This ensures everyone can access and understand your data visualizations, regardless of their device.
- Built-in AI features: Tableau goes beyond just visualization. It leverages built-in AI to automatically identify patterns and trends in your data. These AI features help you uncover hidden gems within your data, allowing you to explore new avenues for data-driven decision-making.
- Active community and support: Tableau has a large and active user community, which is a valuable resource for new and experienced users alike. The community offers extensive learning resources, forums, and user groups, fostering a collaborative environment where users can share insights, learn best practices, and find solutions to common challenges.
Cons of Tableau:
- Technical dependency: Tableau may be a great BI tool, but it isn't magic. While user-friendly, it can be reliant on a strong IT team skilled in SQL and managing high-performance databases. This can slow down the process and limit who can effectively utilize Tableau within your organization.
- Fragmented workflow: Tableau might not be an all-in-one solution. For instance, it won’t do data cleaning and transformation for you. This means you might invest in additional software like e.g. Alteryx if your data states require manipulation, which will add extra costs and complexity to your workflow.
- Costly licensing structure: Tableau can be expensive. Licensing fees can be substantial, especially for larger deployments. Added to that, the need for additional tools (like data prep software) and potential governance/administration costs can make Tableau a significant budget consideration.
- Limited scope: While Tableau shines in visualization, it might not be the complete BI suite. It might lack certain essential BI functionalities like advanced data modeling or robust report scheduling. This might necessitate additional tools or workarounds, hindering your ability to fully leverage this overall well-rounded BI tool. However, if you’re thinking about embedding Tableau into a modern data platform, it will solve all of these shortcomings.
- Mobile experience: while Tableau provides a mobile application, some users find the mobile experience to be less intuitive or feature-rich compared to the desktop version. Accessing and interacting with complex dashboards on smaller screens can sometimes be challenging.
- Limited customization for embedded analytics: while Tableau offers strong capabilities for embedding analytics into applications, some users find the customization options for embedded analytics to be limited compared to dedicated embedded BI platforms. This can be a drawback for software developers or companies looking to seamlessly integrate advanced analytics into their products.
In essence, Tableau offers exceptional visualization tools but may require a significant investment in infrastructure, support, and additional software should you want to perform advanced analytical tasks.
Next in our BI tools comparison: Power BI.
Power BI: democratizing data analysis with deep integration and accessibility
Microsoft Power BI is a web-based tool with a mission to help businesses of all sizes understand their data. It gathers information from your organization's systems and apps, making it a one-stop shop for data analysis. With Power BI, you can easily clean, transform, and visualize your data to uncover hidden trends and make informed decisions. Plus, you can share your findings with colleagues through clear and interactive reports.
Power BI leverages Microsoft's SQL Server Analysis Services to create reusable data models, saving you time and effort. Imagine having pre-built data structures that you can easily adapt to your needs. Furthermore, Power BI integrates seamlessly with your existing apps, allowing you to deliver real-time data insights directly within your workflows.
Power BI isn't limited to your internal data. It provides self-service access to popular cloud services like GitHub, Zendesk, Marketo, and Salesforce. This means you can bring all your data together in one place for a more comprehensive view of your business.
Pros of Power BI:
- One-stop shop: The platform eliminates the need for juggling multiple BI tools. Power BI offers a comprehensive suite of features for data cleaning, transformation, visualization, and collaboration (while some of those are missing in Tableau), streamlining your workflow from start to finish.
- AI-powered analytics: Power BI goes beyond basic visualizations. It leverages built-in AI to create intelligent visualizations and automate machine learning tasks (AutoML). Think of it as having a data analysis assistant by your side instead of having to hire them. These AI features help you discover hidden patterns and trends in your data, leading to more informed decision-making. This is especially valuable when building modern data platforms that rely on advanced analytics.
- Accessibility and ease of use: the BI tool fosters collaboration by providing a common platform for both technical and non-technical users. Technical teams can create clear and accessible data models, while business users can easily comprehend and explore the data without needing extensive SQL knowledge.
- Empowering business users: Power BI empowers business users to become citizen analysts. The user-friendly interface allows even those without advanced SQL skills to manipulate and clean data. Click-through actions provide a drag-and-drop approach to data exploration, making it intuitive and accessible for everyone.
- Extensive data connectivity: Power BI breaks down data silos. No matter where your data resides – Microsoft Excel, text files, cloud databases, or popular data platforms – Power BI seamlessly connects to a wide range of data sources. This allows you to bring all your data together for a holistic view of your business.
- Always up-to-date: Power BI stays current with frequent monthly updates. Imagine your data analysis tools constantly receiving upgrades! These updates ensure you have access to the latest features and performance improvements, keeping you ahead of the curve.
- Scalable licensing: Power BI Premium offers flexible named-user licensing options to suit your organization's needs and scale as you grow. The best part? Power BI offers both free and paid plans. The free version lets you analyze data forever, with a limit of 1GB per user.
- Seamless integration with Microsoft products: Power BI offers unparalleled integration with other Microsoft products, such as Excel, SQL Server, Azure, and Office 365. This integration allows users to easily connect to and import data from these applications, leveraging existing Microsoft infrastructure and tools for BI purposes. For organizations already embedded in the Microsoft ecosystem, Power BI provides a streamlined and cohesive experience.
- Cost-effectiveness: Power BI is known for its competitive pricing, especially when compared to other BI tools on the market. With a free desktop version (Power BI Desktop) for individual users and a low-cost Pro version for more extensive sharing and collaboration features, Power BI is accessible for businesses of all sizes, making it an attractive option for small to medium-sized companies in particular.
- Advanced data visualization and analysis: Power BI provides a rich set of data visualization options, including standard charts, graphs, and maps, as well as advanced visuals through its marketplace. The platform also offers powerful data analysis capabilities, such as quick measures, grouping, forecasting, and the use of DAX (Data Analysis Expressions) for creating custom calculations.
Cons of Power BI:
- Potential complexity: Power BI offers a rich set of features, which can be a double-edged sword. While powerful, it can be overwhelming for new users. A learning curve is involved in navigating the various functionalities and mastering the best tool for each task within Power BI.
- DAX learning curve: To unlock the full potential of Power BI's advanced calculations and customizations, you'll need to learn DAX (Data Analysis Expressions). Think of DAX as a special language for writing formulas within Power BI. While powerful, DAX adds another layer of complexity that some users may find challenging.
- Data preparation and modeling expertise required: While Power BI offers data connectivity and basic transformation capabilities, its data preparation features are sometimes considered less robust compared to standalone data preparation tools or certain competitors. To truly leverage the power of Power BI, a solid understanding of data modeling best practices is crucial. Data modeling involves structuring your data efficiently for analysis. Without this expertise in-house, you might need external help for optimal data model creation, adding additional costs. Alternatively, you may consider outsourcing modern data platform development to an experienced partner.
- Microsoft ecosystem integration: Power BI integrates most seamlessly with existing Microsoft products like Excel and Azure. While Power BI connects to various data sources, deployment and integration might be smoother for organizations already heavily invested in the Microsoft ecosystem.
- Report sharing and collaboration costs: Sharing reports and collaborating within Power BI requires a Pro license or higher, which adds to the overall cost, especially for larger teams or organizations. This can make the platform more expensive compared to some competitors that offer more generous sharing and collaboration features at a lower cost.
Overall, Power BI is a powerful BI platform, but it's not without its complexities. While the free version is a great starting point, organizations that want to maximize its potential might need to invest in additional training or external expertise to navigate the learning curve, master DAX, and optimize data modeling.
The next platform in our BI tools comparison is Qlik Sense.
Qlik Sense: revolutionizing data analysis with associative analytics and self-service BI
Qlik Sense is known for its unique associative data modeling and user-centric approach to data visualization and analytics. It makes storytelling with data effortless.
Ask any question about your data, and watch as it reveals hidden connections and patterns you never knew existed. Built-in AI acts as a data assistant, suggesting insights, automating tasks, and preparing your data for analysis in a blink of an eye.
Here's an extensive overview of why Qlik Sense might be a good option for you and what considerations you should keep in mind.

Pros of Qlik Sense:
- High-performance associative engine: the most distinctive feature of Qlik Sense is its powerful associative engine, which allows users to explore data in a highly intuitive and interactive manner. Unlike traditional query-based BI tools, Qlik Sense automatically associates data from various sources, enabling users to explore data without pre-defined queries or paths. This associative model provides a comprehensive view of the data, revealing insights and relationships that might not be immediately apparent in a linear analysis.
- Self-service analytics: Qlik Sense emphasizes self-service analytics, designed to empower business users with little to no technical background to create their own reports and dashboards. The platform provides a drag-and-drop interface, making it easy for users to visualize data without relying on IT or data analysts. This democratization of data analytics enhances decision-making across all levels of an organization.
- Robust data discovery: Qlik Sense goes beyond basic data visualization. Its exceptional data discovery features empower you to delve deeper. Imagine a tool that can not only highlight trends but also identify missing or inaccurate data within your dimensions. This proactive approach ensures data quality and allows you to address potential issues before they impact your analysis.
- Browser-based accessibility: Qlik Sense eliminates installation headaches. The browser-based interface allows users to access and analyze data from any device with a web browser. This ensures easy deployment and fosters a collaborative environment where everyone can participate in data-driven decision-making.
- Advanced analytics integration: the BI tool integrates with external advanced analytics tools and platforms, allowing users to extend their analyses with sophisticated statistical models and algorithms. This capability enables businesses to leverage predictive analytics and machine learning within the Qlik Sense environment, providing deeper insights and fostering a more analytics-driven culture.
- Responsive and interactive visualizations: Qlik Sense excels in creating responsive and interactive visualizations that adjust automatically to different screen sizes and devices. This responsiveness ensures that users can access and interact with their data analytics on any device, promoting data-driven decision-making on the go.
- Scalability and security: designed to meet the needs of both small businesses and large enterprises, Qlik Sense scales to accommodate growing data volumes and user counts. It also offers comprehensive security features to ensure that data is protected and access is controlled according to organizational policies.
Cons of Qlik Sense:
- Visualization design may be overwhelming: Qlik Sense's visualizations are powerful, but that requires extra focus on clarity of communication. The intricacy of these visualizations may overwhelm some users if not designed carefully. Prior consideration is needed to ensure clarity and effective communication of data insights.
- Customization considerations: Qlik Sense offers a robust platform, but additional configuration efforts might be needed to extend its functionalities for specific use cases. This might be particularly true when integrating R and Python scripting, which requires more technical expertise within your team.
- Limited free version: while a free tier exists for Qlik Sense, it's important to understand its limitations. This version has restricted functionality and will eventually be discontinued. Additionally, it lacks a public report showcase, hindering your ability to share insights broadly. The free tier can be a valuable starting point for familiarization, but organizations should consider paid options for long-term use.
- Data preparation requirements: data preparation is a crucial step in the BI workflow, and while Qlik Sense offers data manipulation capabilities, it might not be the most robust solution in this area. Organizations might need to consider integrating Qlik Sense with additional data preparation tools to optimize their data analysis pipeline.
- Limited collaboration features: Compared to some BI platforms that focus heavily on collaboration and sharing functionalities, Qlik Sense's collaboration features might seem limited. While it offers capabilities for sharing insights and collaborative development, other tools may provide more advanced features for teamwork and communication within the platform.
In essence, Qlik Sense offers exceptional data processing speed and discovery capabilities, making it a powerful BI platform. However, to maximize its effectiveness, careful attention should be paid to visualization design for clarity and consider the potential need for customization or complementary data preparation tools.
Let’s move on to the next item in our BI tools comparison: SAP BusinessObjects.
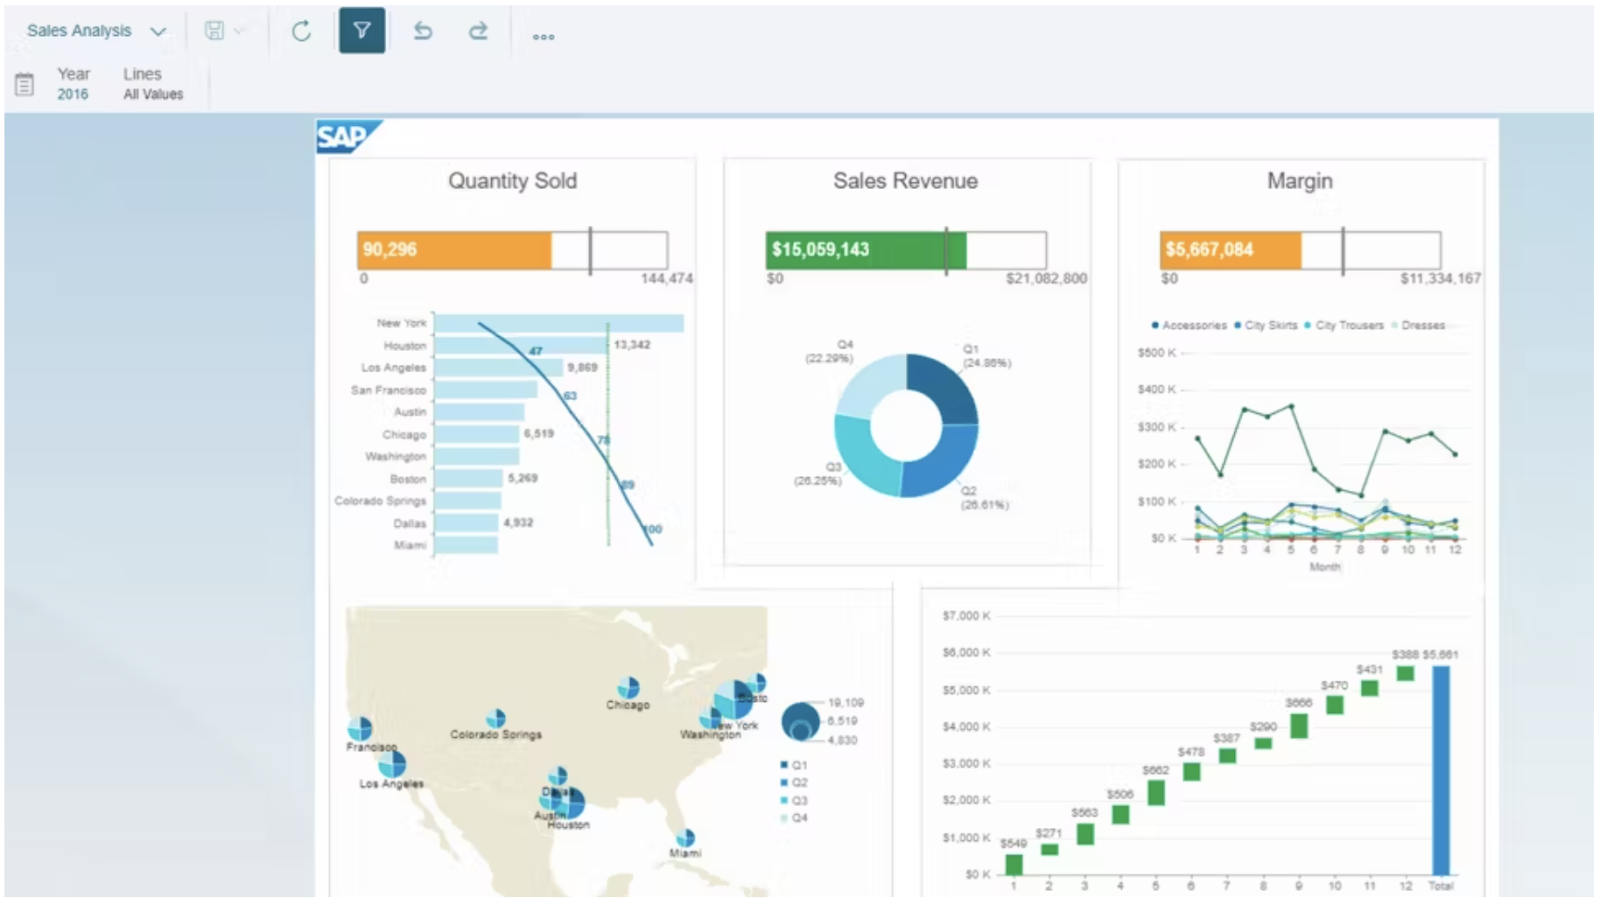
SAP BusinessObjects (BO): comprehensive reporting and analytics for the enterprise
SAP BusinessObjects is a suite of front-end applications that allow business users to view, sort, and analyze business intelligence data. The suite includes a range of applications, including reporting, query and analysis, mobile apps, and office integration tools. It is designed to work both as a standalone suite and to integrate with other SAP applications and data sources. The ability to integrate facilitates efficient handling of data and insights across an organization, supporting decision-making processes with comprehensive analytics.
Pros of SAP BusinessObjects:
- Comprehensive data integration: SAP BusinessObjects excels at data integration, seamlessly connecting to a wide range of data sources beyond just SAP databases. BO offers pre-built connectors for popular cloud applications like Salesforce and Dropbox, as well as databases like Oracle and SQL Server. It offers APIS and other tools to build custom integrations with not-so-popular sources. This empowers organizations to gather information from virtually any internal or external system, fostering a holistic view of their business operations.
- Robust feature set: the BI tool offers a robust suite of reporting tools, including industry-standard solutions like Web Intelligence and Crystal Reports, along with intuitive dashboards. This comprehensive toolbox allows users to create reports tailored to specific needs, ranging from detailed and highly customized analyses to interactive and visually compelling dashboards for broader communication purposes.
- Mobile BI: BO offers mobile apps for accessing reports and dashboards on smartphones and tablets. These apps allow users to stay informed on the go and make data-driven decisions anytime, anywhere.
- Advanced analytical capabilities: SAP BusinessObjects integrates seamlessly with SAP Analytics Cloud, unlocking advanced analytical capabilities. This empowers users to delve deeper into their data by employing sophisticated techniques like predictive analytics.
- Excellent scalability: SAP BusinessObjects boasts exceptional scalability, making it a suitable solution for organizations of all sizes. Whether you're a small business or a large enterprise, the platform can accommodate your evolving data analysis needs. As your data volume and complexity grow, SAP BusinessObjects scales accordingly, ensuring continued support for your expanding analytical requirements.
- User-friendly interface: the BI tool prioritizes user-friendliness across its applications. This focus on intuitive interfaces enables even non-technical users to leverage its functionalities for creating reports and dashboards. This fosters a data-driven culture within organizations by empowering a wider range of employees to actively participate in data exploration and analysis.
- Robust administrative and data governance: SAP BusinessObjects understands the critical importance of data security and provides robust security features designed to safeguard sensitive information. It allows for setting up granular user roles with specific permissions and fine-grained data access control. It also provides comprehensive audit logs that track user activity and data access history, which allows administrators to monitor for suspicious behavior and ensure data security.
- Multilingual support: SAP BusinessObjects supports multilingual deployments, making it an ideal choice for global enterprises that operate in multiple countries. This feature ensures that reports can be generated and distributed in various languages, catering to a diverse workforce.
Cons of SAP BusinessObjects:
- Steep learning curve: while SAP BusinessObjects offers a user-friendly interface within its applications, the sheer breadth of features and functionalities can be daunting for organizations new to SAP or business intelligence in general. Navigating the comprehensive suite and mastering its advanced capabilities can necessitate a significant investment in training and user support.
- Upgrading complexity: upgrading BO can be complex due to a number of factors. Compatibility issues can arise between new features and existing customizations within reports. SAP does offer resources to help companies plan and execute BO upgrades, but you may still require assistance of an independent consulting firm specializing in BO implementations if your internal teams aren’t well-versed in it. It’s also worth noting that the frequency of BO upgrades depends on the specific version and support plan. Typically, SAP releases new versions every few years.
- High total cost of ownership: the total cost of ownership associated with SAP BusinessObjects can be substantial. This encompasses not just the licensing fees but also the implementation costs, which involve professional services to configure and customize the platform to meet specific organizational needs. These factors can make SAP BusinessObjects a less attractive option for smaller organizations with limited budgets.
- Resource-intensive: setting up, maintaining, and managing SAP BusinessObjects effectively often requires a dedicated team with strong IT expertise. This can be particularly true for organizations that require extensive customizations, integrations with existing systems, or complex data management configurations. The reliance on skilled IT resources can create a bottleneck or limit the scalability of the solution for smaller IT teams.
- Performance issues with large datasets: depending on the specific setup and the volume and complexity of the data being processed, users might encounter performance issues. This could manifest as slow loading times for reports or dashboards, particularly when dealing with intricate queries or massive datasets. Careful system optimization and performance tuning might be necessary to ensure an optimal user experience, especially when dealing with large-scale data analysis.
- Transition to Cloud: as SAP prioritizes cloud-based solutions like SAP Analytics Cloud, on-premise users of SAP BusinessObjects may face future pressure to migrate to the cloud solution. You need to carefully consider these factors and the long-term roadmap of SAP when deciding whether to invest in the on-premise version.
SAP BusinessObjects distinguishes itself with its enterprise-level reporting, deep integration with the SAP ecosystem, advanced data connectivity, scalability, security, web intelligence, Crystal Reports, and multilingual support. These features make it particularly suited for large organizations or those heavily invested in SAP products, seeking to leverage complex data across their enterprise for informed decision-making. However, its complexity, cost, and performance with large datasets, may be seen as disadvantages. It’s a solid choice for enterprises already working with other SAP tools.
IBM Cognos Analytics: advanced data exploration with AI-powered insights
IBM Cognos Analytics is an integrated BI and performance management solution that facilitates the exploration and sharing of insights in a governed environment. It offers a web-based interface and is designed to enable business users, analysts, and data scientists to collaboratively harness data for reporting, analysis, dashboard creation, and data exploration.

Cognos provides advanced analytics capabilities, leveraging AI to assist in data preparation, analysis, and visualization, making it easier for users to uncover hidden insights and make data-driven decisions.
Pros of IBM Cognos Analytics:
- Effortless onboarding: IBM Cognos Analytics is designed with user-friendliness in mind, allowing users to start exploring and analyzing data "out of the box." This is a significant advantage, especially for organizations with personnel who may not have a strong technical background in data analysis.
- Intuitive Interface: IBM Cognos Analytics prioritizes user-friendliness. It features a well-designed interface that guides users through the process of data preparation and visualization, simplifying tasks for individuals of varying technical backgrounds. This intuitive approach, augmented by AI-powered suggestions can empower a wider range of employees to actively participate in data exploration and analysis.
- Scalability and adaptability: This is a hallmark of Cognos! The platform is designed to adapt to the evolving needs of organizations, regardless of size. Whether you're a small business with a handful of users or a large enterprise with thousands, Cognos Analytics can accommodate your data analysis requirements. This scalability ensures that the platform remains a valuable asset as your data volume and user base grow over time.
- AI-powered analytics for deeper insights: Cognos goes beyond just providing data visualization tools. It leverages artificial intelligence to empower users to gain more profound insights from their data. The AI capabilities analyze data patterns and suggest the most relevant visualizations, guiding users towards a more comprehensive understanding of the information at hand. This AI-assisted approach can be particularly valuable for users who may be new to data analysis or lack extensive experience in data exploration techniques.
- Unified view of your data landscape: comprehensive data integration is a core strength of Cognos. The platform seamlessly connects to a wide range of data sources, encompassing relational databases, data warehouses, and even big data repositories. This ability to integrate disparate data sources fosters a unified view of your information ecosystem, eliminating data silos and enabling more holistic analysis.
- Emphasis on collaboration: Cognos Analytics recognizes the importance of collaboration in the decision-making process. The platform provides robust functionalities for sharing reports and dashboards securely within your organization. This empowers teams to work together effectively, share insights, and leverage collective knowledge to make informed choices.
- Prioritizing data security and compliance: in today's data-driven world, security and governance are paramount. Cognos Analytics understands this critical need and provides robust features to ensure data access is controlled and adheres to organizational policies. This includes role-based access controls that restrict unauthorized access and a comprehensive audit trail that tracks data usage. These measures safeguard sensitive information and ensure compliance with relevant data privacy regulations.
Cons of IBM Cognos Analytics:
- IT expertise required: setting up data source integrations and customizing reports within Cognos often requires involvement from IT personnel. This can be a bottleneck for businesses with limited IT resources.
- User adoption challenges: while it offers a user-friendly interface, the depth and breadth of its capabilities can be overwhelming for new users, requiring a significant learning curve to utilize its full potential. Regular changes to the platform can lead to user frustration and resistance to adopting new features. Effective communication and training plans are crucial to ensuring a smooth transition for users.
- Mounting costs: IBM Cognos Analytics offers a powerful BI platform, but its power comes at a price. The cost of licensing, along with potential implementation and maintenance expenses, can be a significant investment for smaller to medium-sized businesses. It's essential to weigh the value proposition against your organization's budget and specific needs.
- Potential performance bottlenecks: while Cognos Analytics is a capable tool, its performance can be a concern when dealing with very large and complex datasets. Organizations with massive datasets or highly intricate reporting needs might need to consider alternative BI solutions or implement performance optimization strategies.
- High CPU usage: Cognos Analytics can be a CPU hog, especially when dealing with complex tasks. Imagine a program demanding a lot of processing power from your computer's central processing unit. This high CPU usage can slow down other applications running on your machine, hindering your overall productivity.
- Integration with non-IBM products: while Cognos Analytics offers good integration capabilities, especially within the IBM ecosystem, integrating with non-IBM products and data sources can sometimes be more challenging. This may require additional effort or custom solutions, especially in diverse IT environments.
- Customization limitations: advanced users and organizations with specific customization needs may encounter limitations in Cognos Analytics. Customizing the look, feel, and functionality of dashboards and reports to meet highly specific requirements might require workarounds or additional development effort.
While IBM Cognos Analytics is a powerful and comprehensive BI platform, its complexity, cost, performance with large datasets, UI and usability challenges, integration with non-IBM products, mobile experience, and customization limitations can be seen as drawbacks compared to other BI tools on the market. Organizations considering Cognos Analytics should weigh these factors against their specific needs, technical capabilities, and budget to determine if it is the right choice for their BI and analytics requirements.
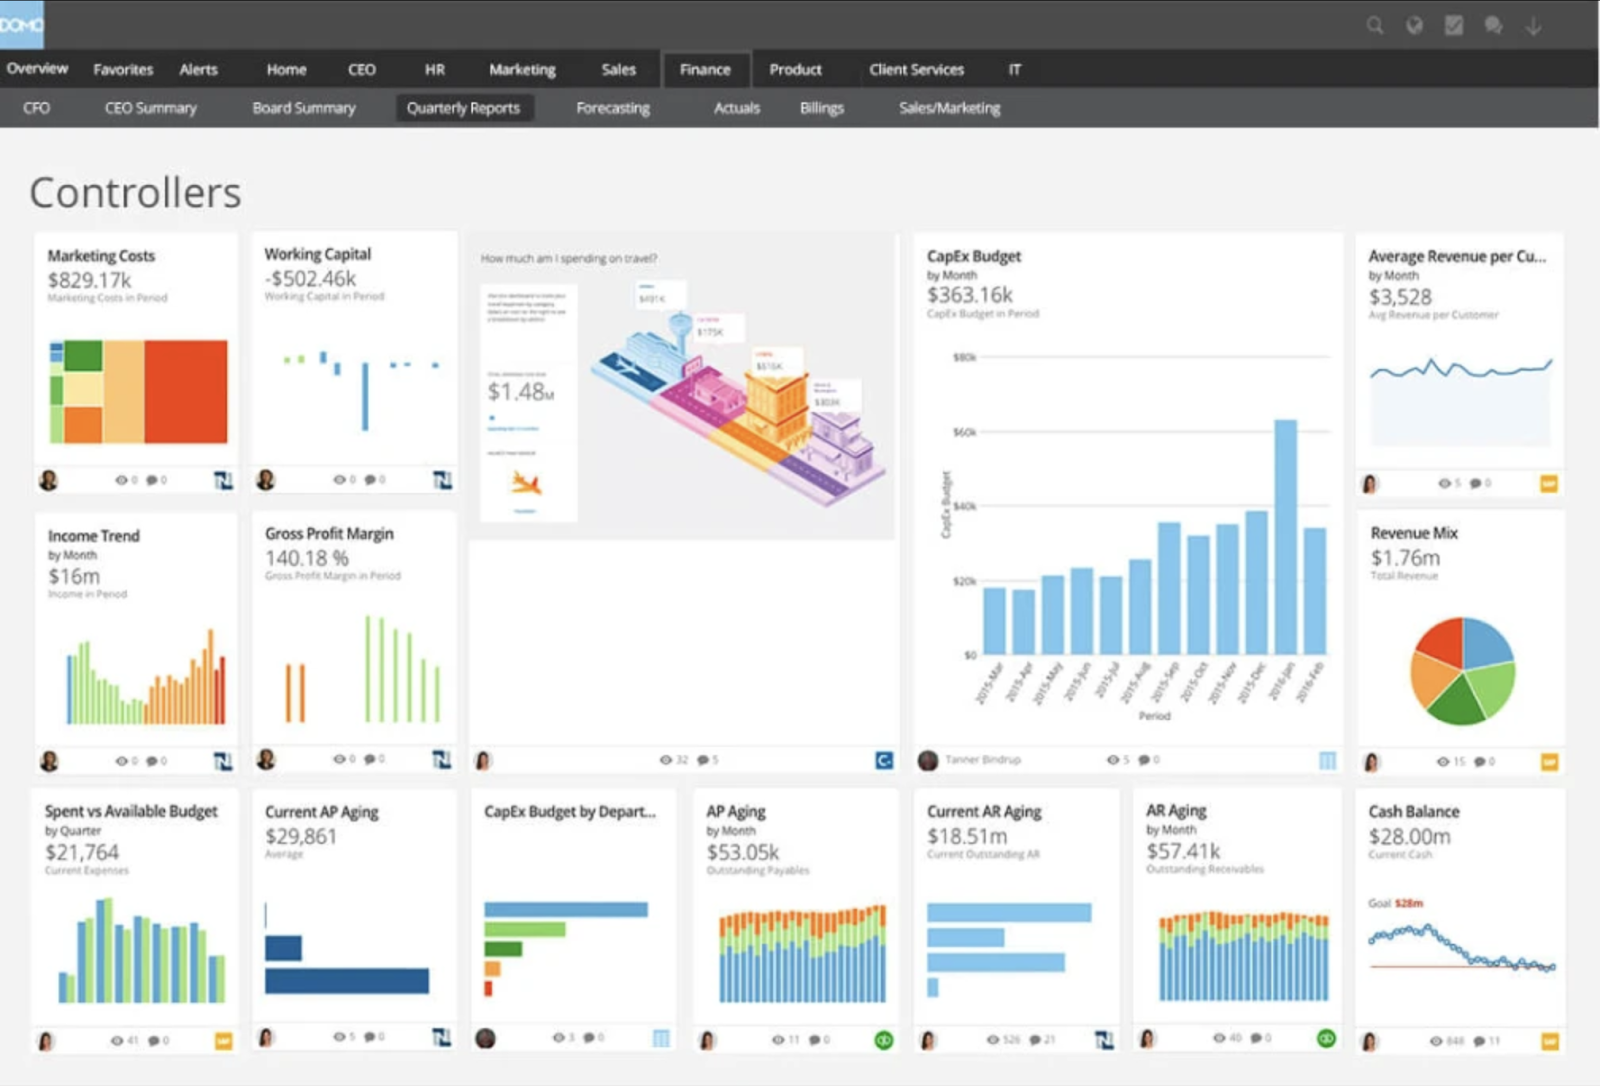
Domo: a powerful BI tool for any data-driven organization
Domo is a cloud-based BI platform that integrates with multiple data sources, including spreadsheets, databases, social media, and any existing cloud or on-premise software solution. It is designed to simplify the process of analyzing and visualizing data for businesses of all sizes. Domo provides real-time data insights, allowing users to make informed decisions quickly. It offers a broad range of features, including data integration, visualization, collaboration tools, and customizable dashboards.
Here's a closer look at the key advantages Domo brings to the table:
Pros of Domo:
- Effortless integration: Domo excels at integrating with a vast array of data sources, including CRM systems, marketing automation platforms, financial applications, and even social media. This eliminates the need for complex data extraction and transformation processes, allowing you to consolidate and analyze all your data seamlessly within a single platform.
- Real-time insights: gone are the days of waiting for data updates! Domo provides real-time data analysis, ensuring your decision-making is based on the most current information available. You can see trends and patterns emerge as they happen, allowing for proactive adjustments and optimizations.
- Democratizing data analysis: Domo empowers everyone in your organization, not just technical experts, to leverage the power of data. The user-friendly interface features a drag-and-drop functionality that makes creating reports and visualizations effortless, even without coding experience. This fosters a data-driven culture where valuable insights are readily accessible to a wider range of personnel.
- Fostering collaboration: the BI tool isn't just about individual analysis; it's about collaborative decision-making. Robust collaboration tools allow teams to share insights, have discussions within the platform, and work together to translate data into actionable strategies. Domo offers a central location where teams can exchange ideas, ask questions, and build a shared understanding of the data driving their success.
- Customizable dashboards: Domo combats information overload with customizable dashboards. Users can personalize their dashboards to display the most relevant metrics and KPIs for their specific role or department. This ensures everyone has the information they need at their fingertips, allowing them to focus on what matters most.
- Embedded analytics: embedding business intelligence into diverse, external applications or websites is, in fact, one of the highlight features. This is done with Domo Everywhere which focuses specifically on providing fully integrated, embedded analytics for easy and secure delivery of data experiences to customers and partners.
- Mobile BI: Domo's mobile app provides on-the-go access to your data and dashboards. This real-time access to data empowers you to make informed decisions anytime, anywhere.

Cons of Domo:
- Cost considerations: Domo's power comes at a price. The subscription-based pricing model scales with the number of users and the amount of data processed. This can be a significant investment, particularly for smaller businesses with limited budgets
- Big Data challenge: Domo is capable of handling large datasets, but complexity can arise as data volume and analysis intricacy increase. Organizations with exceptionally large datasets or highly complex analytical requirements might need to consider alternative BI solutions designed to handle these demands more efficiently.
- Steep learning curve: while Domo boasts a user-friendly interface, there's still a learning curve associated with maximizing its full potential. For users new to BI tools, navigating the platform's extensive features and functionalities might require initial training and familiarization. Organizations should factor in potential training costs or dedicate resources to support user adoption during the implementation process.
- Limited customization: Domo offers robust visualization capabilities, but some users might find the customization options for reports and dashboards to be somewhat limited compared to other BI platforms. This could restrict the ability to tailor reports to meet highly specific formatting or presentation needs. Carefully evaluate your reporting requirements to ensure Domo's customization capabilities align with your desired level of detail and control.
- Online dependence: as a cloud-based platform, Domo relies on a stable internet connection for users to access and utilize its features. This can be a limitation for organizations operating in areas with unreliable or limited internet connectivity. If consistent internet access is a concern, explore alternative on-premise BI solutions that might better suit your needs.
Domo offers a powerful solution for businesses looking to centralize and analyze their data in real-time. It's particularly well-suited for organizations that prioritize collaboration and need a user-friendly interface. However, potential users should consider the costs and ensure that the platform's capabilities align with their specific data analysis and reporting needs.
Sisense: simplifying complex data with interactive analytics
Sisense is a BI and analytics software that enables organizations to merge, analyze, and visualize large datasets from various sources in a simplified manner. It's designed for users ranging from technical data analysts to non-technical business users, providing a platform that supports the entire data analysis process, from data preparation to creating dashboards and reports. Sisense aims to make data-driven decision-making accessible to all levels of an organization through its innovative technology and user-friendly interface.
Pros of Sisense:
- End-to-end data and analytics platform: Sisense offers a comprehensive, end-to-end analytics platform that integrates data from multiple sources, transforms it into a unified repository, and then allows for the creation of interactive dashboards and reports. This seamless process, from data integration to visualization and analytics, is a significant advantage for companies looking to streamline their data analysis processes.
- Proprietary In-Chip technology for extra speed: Sisense boasts a revolutionary approach to data processing with its In-Chip technology which optimizes data processing speeds by making better use of the computer's CPU. This unique technology optimizes data storage and access within memory, resulting in significantly faster query response times and analysis speeds compared to traditional in-memory solutions.
- Embeddable insights: Sisense goes beyond traditional reporting. It offers robust capabilities for embedding analytics directly into customer-facing applications. Imagine providing your users with real-time data insights within the software products they interact with daily, helping you to enhance the user experience.
- Ease of use for non-technical users: A key focus for Sisense is making data analytics accessible to users of all skill levels, including those without a technical background. Its drag-and-drop interface and intuitive dashboard design tools allow business users to create, modify, and interact with reports without needing to code or rely heavily on IT support. This democratization of data analytics enhances decision-making across all levels of an organization – everyone can be a storyteller with Sisense!
- Scalability: Sisense is built to scale, making it a valuable asset for businesses of all sizes. Whether you're a small startup or a large enterprise, Sisense can accommodate your evolving data needs. The platform effortlessly handles large data volumes and complex analyses without sacrificing performance.
- Prioritizing security: Security is paramount when dealing with sensitive business information. Sisense takes data security seriously, providing comprehensive security features to safeguard your data. Encryption and access controls ensure that only authorized users can access specific data sets, while robust monitoring helps maintain data integrity. This focus on security gives you peace of mind, knowing your valuable data is well-protected.
- ElastiCube technology: Sisense utilizes ElastiCube technology, a high-performance database that supports the rapid querying of large datasets. ElastiCube allows for the aggregation of data from multiple sources into a single, optimized format, enabling faster analysis and insight generation. This technology supports Sisense's scalability and performance, making it an excellent option for businesses dealing with diverse and voluminous data.

Cons of Sisense:
- Learning curve: while Sisense boasts a user-friendly interface, there's a spectrum of user experience. Basic tasks like creating reports and dashboards are readily accessible, but venturing into advanced features like complex data manipulation or creating highly customized visualizations requires a steeper learning curve.
- Cost considerations: Sisense's pricing structure can be a barrier for smaller organizations or startups. Consider it a premium product that delivers robust features, but at a premium cost.
- Complexity preventing self-service analytics: setting up Sisense for highly specific or complex use cases can involve significant effort. Imagine configuring the platform for a unique data analysis process. This might necessitate assistance from Sisense's support team or a specialized consultant.
- Performance considerations for large datasets: while Sisense is adept at handling large datasets, exceptionally large or intricate datasets might lead to performance issues, especially on less powerful hardware. Imagine a computer struggling to handle a massive amount of data – this can lead to slow query processing and sluggish user experience.
- Limited visualization options: some users might find the variety of visualization options in Sisense to be limited compared to other BI tools. This could restrict the ability to present data in the most impactful way for specific audiences.
Sisense's unique value lies in simplifying complex data analytics, making it accessible and actionable for businesses of all sizes. Its unique combination of In-Chip and ElastiCube technologies offers superior performance and scalability. Coupled with its focus on embeddable analytics and user-friendly design, Sisense provides a powerful, flexible platform for data-driven insights. However, potential users should carefully consider the platform's cost, the technical skill level required for advanced customizations, and how the platform's features align with their specific business requirements.
MicroStrategy: driving enterprise analytics with powerful, scalable BI solutions
MicroStrategy is a comprehensive BI and analytics platform that provides advanced data analytics capabilities, including interactive dashboards, scorecards, reports, and data discovery features. It enables organizations to analyze vast amounts of data and distribute insights across the enterprise.
MicroStrategy supports data analytics on a wide range of data sources, from traditional databases to big data and cloud services. It's designed to cater to both technical and non-technical users, offering tools for data visualization, mobile analytics, cloud deployments, and more.
Pros of MicroStrategy:
- Enterprise scalability and performance: MicroStrategy is designed for scalability, capable of supporting the data needs of large enterprises. It stands out for its ability to handle vast amounts of data across complex data models without compromising on performance. This scalability is a key differentiator, making it suitable for organizations with large datasets looking to perform intricate analyses.
- Advanced analytics integration: MicroStrategy integrates with a wide array of advanced analytics functions, including predictive analytics, big data analytics, and real-time analytics. It offers seamless integration with R and Python, allowing analysts and data scientists to leverage statistical and machine learning models within their BI environment. This integration enables more sophisticated data analysis compared to many competitors, providing deeper insights and predictive capabilities.
- Mobile analytics leadership: the BI platform has been recognized for its superior mobile BI capabilities. MicroStrategy's mobile app allows users to access dashboards and reports on the go, providing a rich, interactive user experience optimized for mobile devices. This mobile-first approach ensures decision-makers have access to critical insights anytime, anywhere, which is a significant advantage over competitors that may not offer as robust mobile solutions.
- High security standards: MicroStrategy places a strong emphasis on security, offering comprehensive security features that include end-to-end encryption, multi-factor authentication, and sophisticated user and object-level security models. For industries where data security is paramount, such as finance and healthcare, MicroStrategy's commitment to security can be a key reason to choose it over other BI tools.
- HyperIntelligence Feature: a standout feature unique to MicroStrategy is HyperIntelligence, which aims to deliver insights and analytics directly into users' workflows without requiring them to actively engage with a BI application. HyperIntelligence brings intelligence to the surface automatically by embedding zero-click insights into web browsers, emails, and mobile apps, making data more accessible and actionable for all levels of users. This feature represents a significant innovation in how users interact with data, setting MicroStrategy apart from competitors.
Cons of MicroStrategy:
- Learning curve: MicroStrategy's wide range of features and the depth of its analytical capabilities can result in a steep learning curve for new users. Its complexity, particularly in designing and deploying advanced analytics solutions, may require significant training and expertise, which can be a barrier to quick adoption.
- Cost: it is often considered more expensive than some of its competitors, especially for small to medium-sized businesses. The licensing, implementation, and maintenance costs, along with the need for specialized training, can add up, making it a significant investment.
- Performance issues with complex reports: some users report performance issues when working with highly complex reports or analyzing very large datasets. While MicroStrategy is designed for scalability, its performance can vary based on the complexity of the data models and the hardware in use.
- User interface: some users find the user interface (UI) of MicroStrategy to be less modern or intuitive compared to newer BI tools that focus heavily on user experience design. This can impact user adoption and satisfaction, especially among non-technical users.
- Limited customization and flexibility: Although MicroStrategy offers extensive customization options, customizing reports and dashboards to meet specific organizational needs can sometimes be more cumbersome or less intuitive compared to other BI tools that prioritize ease of use and flexibility.
- Deployment and maintenance: the process of deploying and maintaining a MicroStrategy environment, especially in complex IT landscapes, can be challenging and resource-intensive. Ensuring optimal performance and scalability might require ongoing IT support and infrastructure investment.
- User interface: some users find the user interface (UI) of MicroStrategy to be less modern or intuitive compared to newer BI tools that focus heavily on user experience design. This can impact user adoption and satisfaction, especially among non-technical users.
MicroStrategy is a powerful BI tool that offers deep analytical capabilities and extensive data connectivity options, making it suitable for enterprises with complex data analytics needs. However, potential adopters should carefully consider the platform's complexity, cost, and the resources required for implementation and ongoing maintenance.
How to select the right BI tool for your needs?
Selecting the right BI tool is crucial for any organization looking to derive actionable insights from its data. Each of the mentioned tools - Tableau, Power BI, Qlik Sense, SAP BusinessObjects, IBM Cognos Analytics, Domo, Sisense, and MicroStrategy - offers unique features and capabilities. Let's compare them across several key aspects to help business owners make an informed decision.
Choosing the right BI tool for your organization involves a careful evaluation of your business needs, the data landscape, and the specific features offered by various BI solutions. Here's a structured approach to help you select the right BI tool:
Step 1: Assess your business needs
Determine what you aim to achieve with the BI tool, such as improved decision-making, enhanced data visualization, or more efficient reporting. Consider who will be using the tool (e.g., data analysts, business users, IT staff) and what their specific needs are, including ease of use, mobile access, and the ability to perform advanced analytics.
Step 2: Evaluate your data infrastructure
Identify all the data sources you need to integrate with the BI tool, including databases, cloud services, and external APIs. Estimate the volume of data you'll be working with and the complexity of the data models, as this can impact the performance and scalability of the BI tool.
Step 3: Consider key features and capabilities
Decide whether you need robust visualization and reporting features that can present data in an easily digestible format, a tool that is capable of data cleaning, transformation, and integration, ensure the tool can scale with your business, collaboration features, mobile access, advanced security features, or any other. Identifying relevant priorities is a crucial step. I’m including recommendations based on some of the priorities you may have further below.
Step 4: Check integration and compatibility
This is about understanding what the BI tool has to integrate within your existing IT infrastructure, including databases, ERP systems, and cloud platforms. Compatibility with your current systems will minimize the need for significant changes to your data ecosystem.
Step 5: Review pricing
Compare the pricing models of different BI tools, including upfront costs, subscription fees, and any additional costs for implementation, training, and maintenance. Consider the total cost of ownership over time, not just the initial expense.
Step 6: Consider vendor support and community
Assess the level of support provided by the vendor, including customer service, training materials, and user communities. A strong support network can be crucial for troubleshooting and maximizing the value of the BI tool.
Now that you’ve identified the essential criteria and priorities, let's take a look at which tools would efficiently respond to those needs and support your organization's growth and evolution over time.
Priority: robust data integration and handling
- If robust data integration capabilities are your priority, opt for Tableau, Power BI, Qlik Sense, or Domo. They allow users to connect to a wide range of data sources, including cloud and on-premise databases, spreadsheets, and more.
- If you’re looking to integrate with SAP and non-SAP applications, consider SAP BusinessObjects. It provides strong data management and reporting features, especially for existing SAP ecosystems, but also integrates well with other sources.
- Are you looking for solid enterprise-grade reporting, scalability, and governance features? In that case, IBM Cognos Analytics and MicroStrategy are highly regarded in those spheres, and offer extensive data integration options.
- If handling complex datasets and analytics is your additional priority, then Sisense, with its In-Chip technology that accelerates data processing, stands out as a particularly good option.
Priority: ease of use and simple interface
- If you’re looking for intuitive, user-friendly interfaces that make data visualization accessible to users of all skill levels, consider Tableau, Power BI or Domo, which all stand out in this capacity.
- Self-service analytics with a strong emphasis on guided analytics paths and associative data modeling are assured by Qlik Sense.
- If you’re looking for a modern, web-based interface designed for collaboration, with real-time data updates and mobile access, opt for Domo.
- SAP BusinessObjects, IBM Cognos Analytics, Sisense, and MicroStrategy offer powerful analytics capabilities but may have a steeper learning curve compared to the more user-centric BI tools.
Priority: visualization and reporting
- If you’re looking for a wide variety of chart types and visualization options, Tableau is a leader in those areas.
- If you’re using Microsoft products, Power BI is a very strong candidate, with strong visualization capabilities and a focus on integration within the Microsoft ecosystem.
- Qlik Sense and Domo offer interactive visualizations and dashboards with an emphasis on self-service analytics.
- SAP BusinessObjects, IBM Cognos Analytics, and MicroStrategy are more traditional in their reporting approaches but offer comprehensive tools for enterprise reporting and complex analytics.
- If you’re looking for highly customizable dashboards and embedded analytics, suitable for businesses looking to offer BI capabilities within their own products or services, then Sisense might be your best choice.
Priority: scalability and performance
- MicroStrategy and IBM Cognos Analytics excel in enterprise-scale deployments, offering robust governance and scalability.
- SAP BusinessObjects is suitable for large enterprises, particularly those already embedded within the SAP ecosystem.
- Tableau, Power BI, and Qlik Sense scale well for a wide range of businesses, from small to large enterprises, with varying performance based on deployment options (cloud vs. on-premise).
- Domo and Sisense are cloud-native solutions designed for scalability and performance, leveraging cloud resources to handle large datasets efficiently.
Priority: cost and investment
- Power BI offers a competitive price point, especially attractive for small to medium businesses and those already using Microsoft services.
- Tableau, Qlik Sense, and Domo have pricing models that can scale with usage and the number of users, offering flexibility for growing businesses.
- SAP BusinessObjects, IBM Cognos Analytics, Sisense, and MicroStrategy might represent a higher upfront investment but are tailored for enterprises needing extensive BI capabilities and data governance.
Take the next step in your BI adoption journey
The decision on which BI tool to adopt should be based on several factors, including the specific needs of the business, the size and complexity of the data, the skill level of the users, integration capabilities with existing systems, and budget. It's also important to consider the future growth of the organization and how well the tool can scale to meet evolving needs.
Demos and trials can be invaluable for assessing how well a particular tool fits with your organization's workflow and data analytics needs. Alternatively, you can consult with an external partner who could help you advise on the best options, taking into account your unique criteria. If you’d like to discuss this matter further with us, just send us a message via this contact form and we’ll get back to you.

.png)

