

The most valuable business currency today? Data. Thriving businesses rely on it; they know that innovation and growth comes with informed decision-making. Whether it's optimizing operations, understanding customer behavior, or identifying emerging trends, the ability to harness the power of data is paramount. It’s no wonder that we’re observing increasing adoption of business analytics and business intelligence.
What exactly is the difference between these two important business aspects? They are directly related, but serve different purposes. Without a clear understanding of the nuances between business analytics and business intelligence, businesses risk misdirecting their resources and failing to extract maximum value from their data investments.
In this blog, I‘m shedding light on both terms so that you could easily comprehend the distinction and enter the landscape of data-driven decision-making equipped with just the knowledge you need.
Business intelligence vs business analytics
Although business analytics (BA) and business intelligence (BI) are closely related concepts in the broader field of data-driven decision-making, they are not exactly the same. They serve overlapping, but distinct purposes. Understanding the difference between those two will help you identify the right tools, methodologies, and approaches you need to achieve your business goals and objectives.
Both BI and BA are essential components of a comprehensive data strategy, working together to help organizations derive actionable insights and drive business performance. Let’s examine BI first.
What is business intelligence?
BI refers to the iterative process of collecting, organizing, analyzing, and presenting data to support decision-making within an organization. It focuses on descriptive analytics, which involves summarizing historical data to provide insights into past and current performance. BI tools and techniques are primarily used to generate reports, dashboards, and visualizations that help stakeholders monitor KPIs, track business metrics, and gain a holistic view of organizational performance.
Business intelligence involves the systematic gathering of data from internal and external sources, including databases, enterprise systems, spreadsheets, cloud-based applications, and external data providers. This data is then processed and transformed through various techniques, such as data cleansing, data integration, and data modeling, to ensure accuracy, consistency, and completeness.
Here are some of the top BI tools:
Popular examples of BI tools and platforms include:
Roles required to enable business intelligence
Building BI capacity in an organization requires a multidisciplinary team with a range of skills and expertise to implement, and maintain BI solutions effectively. Here are the key roles required to implement BI:
- BI analyst: responsible for gathering business requirements, translating them into technical specifications, and designing BI solutions that meet the needs of stakeholders.
- Data engineer: responsible for building and maintaining the data infrastructure and pipelines that support BI solutions.
- Database administrator: responsible for managing and optimizing the databases and data warehouses that store organizational data.
- BI developer: responsible for building and maintaining the BI infrastructure, including data models, dashboards, and reports.
Key features and capabilities
- Data aggregation and integration: BI platforms enable organizations to aggregate and integrate data from multiple internal and external sources, including databases, spreadsheets, enterprise systems, and cloud-based applications. Centralizing data into a unified data warehouse or data mart, offers a single source of truth for reporting and analysis, ensuring data consistency, accuracy, and reliability across the organization.
- Reporting and dashboarding: one of the primary functions of BI. Business intelligence reporting tools allow users to create ad-hoc reports, predefined reports, and scheduled reports, while dashboarding capabilities enable the visualization of KPIs and trends through charts, graphs, gauges, and other visual elements.
- Ad-hoc querying and analysis: BI platforms also empower users to perform on-the-go analyses of data without the need for advanced technical skills or programming expertise. Self-service BI tools provide intuitive interfaces and drag-and-drop functionality that enable users to explore data, create custom queries, and generate on-the-fly reports to answer specific business questions and uncover insights in real time.
- Data visualization: BI platforms offer robust data visualization tools that enable users to create interactive dashboards, reports, and visualizations from multiple data sources. These visualizations include charts, graphs, maps, and other graphical representations that help users understand data patterns, trends, and relationships at a glance.
- Data modeling: these BI capabilities allow users to design and optimize data models and schemas for efficient data storage and retrieval. Users can define relationships, hierarchies, and calculations within data models to support complex analytics workflows and enable advanced analysis and reporting.
Examples of business intelligence use cases
- Sales and revenue analysis: sales managers can use BI dashboards to monitor sales performance by region, product, or sales representative, identify top-performing products or services, and optimize sales strategies accordingly. They can also forecast future sales and set realistic sales targets based on historical data and market trends.
- Customer segmentation and analysis: marketing teams can use BI analytics to identify high-value customer segments, tailor marketing campaigns to specific customer groups, and personalize product recommendations and promotions. Customer feedback analysis help to identify areas for improvement and enhance the overall customer experience.
- Financial reporting and analysis: CFOs and financial analysts can use BI dashboards to monitor key financial indicators, track budget vs. actual performance, and identify cost-saving opportunities. They can also conduct scenario analysis and what-if simulations to assess the impact of different financial strategies and decisions on the organization's bottom line.
- Operational efficiency and performance monitoring: operations managers can use BI dashboards to track key performance metrics, such as production output, inventory levels, and resource utilization, in real time. Identifying bottlenecks, inefficiencies, and areas for improvement is critical for improving processes, reducing costs, and boosting overall operational efficiency.
- Supply chain management and logistics: supply chain managers can use BI analytics to track supplier performance, monitor inventory levels, and optimize procurement processes. Analyzing this kind of data can help businesses to identify opportunities to reduce supply chain risks, improve supplier relationships, and enhance customer satisfaction.
As you can see, business intelligence also serves as an enabler of driving operational excellence, optimizing business processes, and gaining competitive advantage in today's data-driven marketplace.
Let’s now move on to discover business analytics and what it has to offer.
What is business analytics?
Business analytics encompasses the process of exploration, interpretation, and transformation of raw data to derive insights, make predictions, and drive strategic decision-making. BA includes descriptive analytics, predictive analytics and prescriptive analytics.
Descriptive analytics focuses on historical data to understand past behaviors and events. The key activities within descriptive analytics include data aggregation, data mining, and basic statistical analysis. It serves as a preliminary step that often precedes more complex analytical approaches such as predictive analytics (forecasting future events) and prescriptive analytics (suggesting actions to achieve desired outcomes).
Predictive analytics involves using statistical modeling and machine learning algorithms to forecast future outcomes and trends, while prescriptive analytics focuses on recommending actions to optimize business processes and outcomes.
In addition, the data analysis is performed in context of the underlying business objectives, relevant metrics and KPIs, and translating analytical findings into actionable recommendations for driving measurable outcomes.
Ultimately, business analytics serves as a critical catalyst for organizational transformation and competitive advantage in today's data-driven economy. It’s an indispensable component of modern data stack that enables organizations to adapt, innovate, and thrive in an increasingly complex and dynamic business landscape.
In today’s world, BA is essential for decision-makers at all levels of an organization, from executives and managers to front-line employees, across various functional areas including marketing, sales, operations, finance, HR, and customer service.
Popular examples of BA tools and platforms include:
Roles required to enable business analytics
Implementing business analytics in an organization requires a diverse team of professionals with specialized skills and expertise in data analysis, statistical modeling, and domain knowledge. Here are the key roles:
- Data analyst: responsible for collecting, cleaning, and analyzing data to uncover insights and trends that drive decision-making.
- Data scientist: responsible for developing predictive models, algorithms, and data-driven solutions that address business challenges and opportunities.
- Database administrator: responsible for ensuring data integrity, security, and availability by implementing database management systems, monitoring performance, and troubleshooting issues.
- Business analyst: responsible for bridging the gap between business needs and technical solutions by understanding business requirements, defining analytics use cases, and prioritizing analytics initiatives.
- Data engineer: responsible for designing, building, and maintaining data pipelines and infrastructure that support data analytics and machine learning workflows. They will also develop ELT (Extract, Load, Transform) processes, data integration pipelines, and warehousing solutions for data ingestion, processing, and storage of large volumes of data from disparate sources.
Key features and capabilities of business analytics
- Data analysis and visualization: the core of BA is the ability to analyze vast datasets using advanced statistical algorithms and visualization techniques. From simple trend analysis to complex predictive modeling, you can gain valuable insights into past performance and future trends.
- Predictive modeling and forecasting: BA empowers organizations to move beyond historical data analysis and venture into the realm of predictive modeling. Leveraging techniques such as regression analysis, machine learning, and time series forecasting, allows businesses to anticipate future outcomes and proactively plan for success.
- Statistical analysis: central to the BA toolkit is the application of statistical techniques to uncover patterns, relationships, and anomalies within data. From hypothesis testing to clustering analysis, you can extract valuable insights that drive informed decision-making and strategic planning.
- Real-time data analysis: with the proliferation of real-time data streams and IoT devices, BA has evolved to support real-time data analysis and decision-making. Stream processing technologies, such as Apache Kafka and Apache Flink, enable businesses to ingest, process, and analyze data in motion, allowing for timely insights and rapid response to emerging opportunities and threats.
- Self-service analytics: business analytics platforms increasingly emphasize self-service capabilities that empower users to explore and analyze data independently, without heavy reliance on IT or data science teams. User-friendly interfaces, drag-and-drop functionality, and intuitive data visualization tools enable non-technical users to access, manipulate, and interpret data to derive insights and make informed decisions.
Examples of business analytics use cases
Applications of BA are diverse and offer vast potential for uncovering new insights – creativity is your only limit when it comes to finding new ways to apply it. Here are some of the typical use cases that allow businesses to drive tangible business outcomes, improve decision-making, and create value for organizations in today's data-driven world.
- Sales forecasting: a retail chain can use predictive analytics to anticipate seasonal fluctuations in consumer purchasing behavior and optimize inventory levels accordingly. This can help minimize stockouts, reduce excess inventory, and maximize revenue potential.
- Fleet management: data analytics helps companies monitor and manage their fleet of vehicles more effectively by tracking key metrics such as vehicle location, speed, fuel consumption, and maintenance status in real time. Predictive analytics algorithms can anticipate potential equipment failures and schedule proactive maintenance to minimize downtime and ensure fleet reliability.
- Customer Lifetime Value (CLV) analysis: an e-commerce company can use predictive modeling to identify customers likely to make repeat purchases and personalize marketing campaigns to enhance customer loyalty and maximize lifetime value.
- Fraud detection and risk management: financial institutions can deploy machine learning algorithms to detect fraudulent credit card transactions based on transaction frequency, location, and spending patterns, thereby reducing financial losses and protecting customer assets. BA plays a crucial role in detecting and mitigating fraud across various industries, including banking, insurance, and healthcare.
- Supply chain optimization: a manufacturing company can use predictive analytics to forecast demand for raw materials and optimize production schedules to minimize inventory holding costs while ensuring timely delivery of finished goods to customers. Optimizing supply chain operations is critical for minimizing costs, improving efficiency, and enhancing customer satisfaction.
- Healthcare analytics: healthcare providers can leverage predictive analytics to identify patients at risk of readmission based on clinical data, demographics, and social determinants of health. In the healthcare industry, business analytics is already being used to improve patient outcomes, optimize resource utilization, and enhance operational efficiency.
- Social media analytics: a consumer goods company can use sentiment analysis to monitor social media conversations and gauge public perception of its products or services. BA tools enable businesses to extract valuable insights from social media data to inform marketing strategies, brand management, and customer engagement initiatives.
Let’s now take a quick recap that will allow us to pinpoint the key differences between business analytics and business intelligence.
Business intelligence vs business analytics – a quick comparison
Let’s just recap:
- BA encompasses a broader range of analytical techniques, including predictive modeling and optimization, to forecast future outcomes, identify opportunities, and optimize business processes.
- BI primarily focuses on providing historical and real-time insights into past and current performance, enabling stakeholders to monitor trends, track KPIs, and identify areas for improvement.
Business intelligence vs business analytics – which one do you need?
Determining when you require BA vs BI solutions depends on the specific objectives, challenges, and analytical requirements of the organization.
Here's a breakdown of when business intelligence may be sufficient for your needs:
- Extending descriptive reporting: BI is ideal for organizations that primarily require descriptive reporting and historical analysis of data to monitor performance, track key metrics, and generate standard reports and dashboards. BI tools excel at providing a comprehensive view of past and current performance across various aspects of the business.
- Boosting operational efficiency: BI is valuable for improving operational efficiency by providing real-time insights into business processes, identifying bottlenecks, and optimizing resource allocation. It enables organizations to monitor KPIs, track trends, and make data-driven decisions to enhance operational performance.
- Supporting executive decision-making: BI is beneficial for supporting executive decision-making by providing high-level summaries and aggregated views of business performance. It enables executives to monitor strategic objectives, identify trends, and gain insights into overall business health to inform strategic planning and decision-making.
In contrast, you may want to consider investing in business analytics if you’re looking for:
- Business forecasting: BA is essential for organizations that require predictive modeling and advanced analytics capabilities to forecast future trends, identify opportunities, and mitigate risks. BA tools leverage statistical techniques and machine learning algorithms to analyze historical data and make data-driven predictions.
- Optimization and strategy enhancement: BA is valuable for optimizing business processes, identifying inefficiencies, and developing data-driven strategies to achieve business objectives. It enables organizations to identify areas for improvement, simulate scenarios, and optimize resource allocation to maximize efficiency and effectiveness.
- Complex analysis and insights: BA is beneficial for conducting complex analysis and deriving actionable insights from large and diverse datasets. It allows organizations to uncover hidden patterns, correlations, and trends in data, enabling them to gain deeper insights and make informed decisions to drive business performance.
Leveraging a modern data platform for business analytics and Intelligence capabilities
Both business intelligence and business analytics require a modern and effective tech stack to support these capabilities. This is where modern data platforms come into play.
A modern data platform is a comprehensive and integrated technology stack designed specifically to support the BA and BI tools. They enable effective management, processing and analysis of large data for effective extraction of insights. They offer a systematic approach to data storage, data integration, data processing, analytics, and employing visualization tools. As such, a modern data stack lays the foundation for smooth implementation of advanced analytical capabilities such as machine learning, artificial intelligence, and real-time data processing.
Here’s what the modern data platform we’ve already implemented for several of our clients look like:
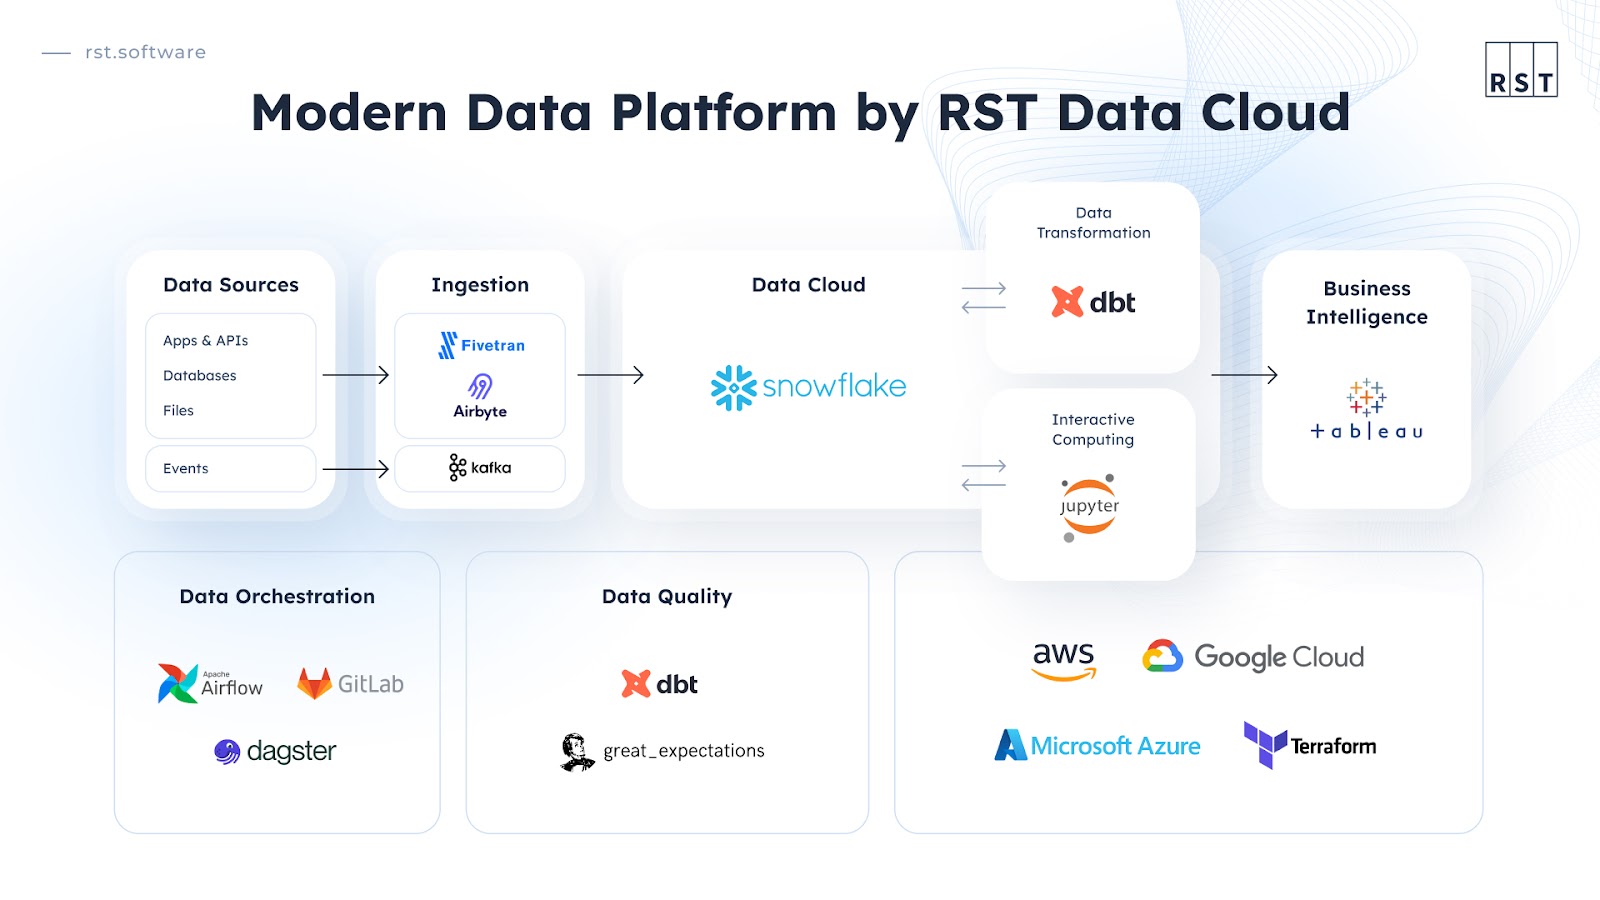
RST Data Cloud allows organizations to tap into new insights from extensive and diverse data sources faster than ever before and with much greater efficiency. The unique tech stack ensures:
- Unified data management: a centralized repository for storing, managing, and organizing diverse types of data, including structured, semi-structured, and unstructured data through Snowflake.
- Data integration and connectivity: to support data ingestion from various sources, including databases, data warehouses, cloud applications, IoT devices, and streaming data sources, also for real-rime analytics.
- Scalability and performance: the data platform is designed to scale horizontally and vertically to accommodate growing data volumes, user concurrency, and analytical complexity, so that the changing market and business needs can be catered for swiftly.
- Real-time data processing: the application of Apache Kafka supports real-time data processing and analytics capabilities to analyze data as it is generated, enabling organizations to detect and respond to events and trends as they occur, enhancing both BI and BA initiatives.
- Self-service analytics and data discovery: user-friendly interfaces, intuitive data visualization tools, and interactive dashboards that empower users to create ad-hoc queries, perform data exploration, and generate custom reports and visualizations, accelerating insights discovery and decision-making – without relying on IT or data specialists.
If you’d like to learn more about business intelligence, business analytics or our Modern Data Stack, feel free to submit your query through this contact form.
We’ll be happy to advise on how to centralize data management, integrate diverse data sources, scale infrastructure dynamically, enable advanced analytics and machine learning, process real-time data, ensure data governance and compliance, and empower self-service analytics and data discovery. Are you ready to drive better business outcomes and unlock competitive advantages through BI and BA initiatives? Just reach out to us and we’d gladly support you on this journey.


